Central Logging for Your Homelab: Loki, Grafana, and Alloy
June 13, 2026Tutorials
Set up a lightweight central logging stack that collects logs from every service in your homelab — Jellyfin, Sonarr, Radarr, Caddy, Immich, AdGuard Home, and more — into a single Grafana interface you can actually search.
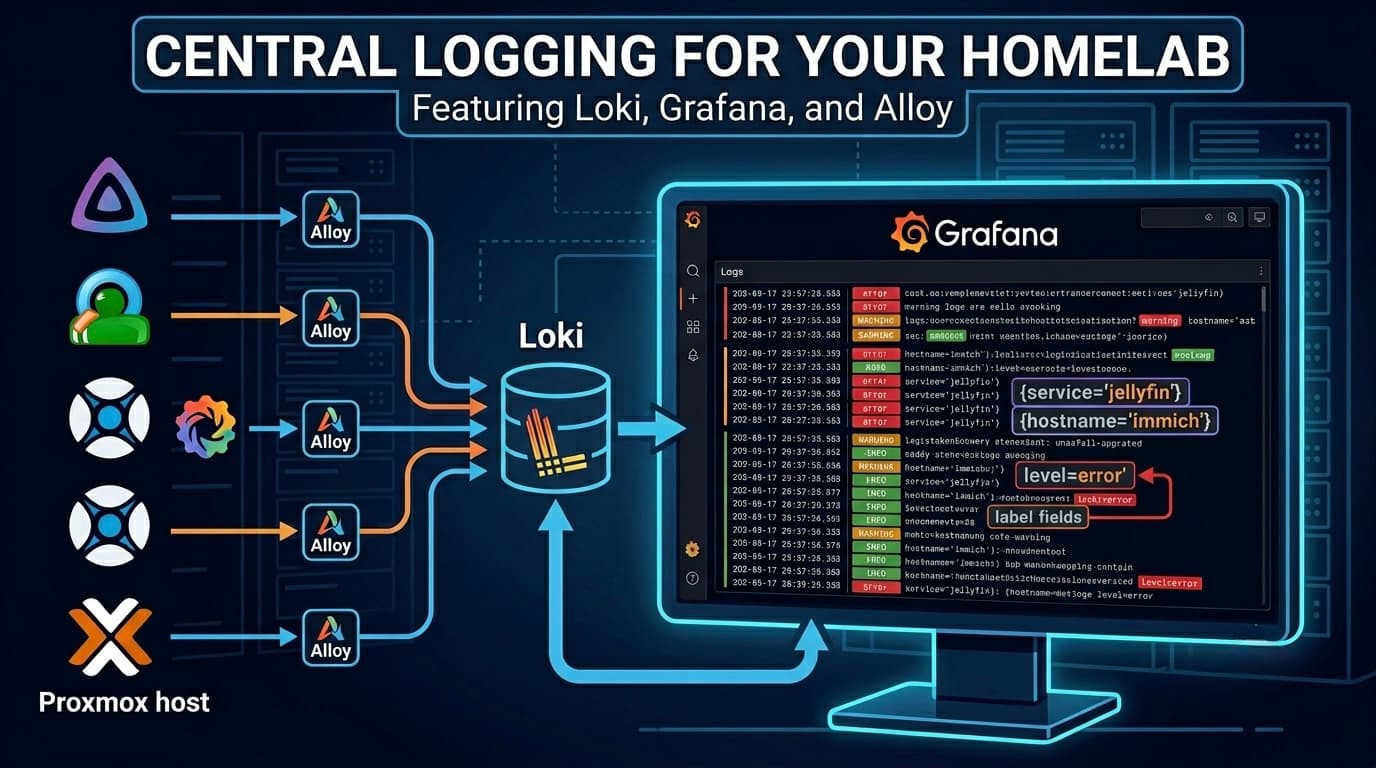
Before this, every time something broke I was jumping between LXCs — pct exec 153 -- bash, tail a log, exit, pct exec 160 -- bash, tail another. No way to correlate events across services, no history beyond what was still in the log file. A Sonarr grab failing at the same time AdGuard blocked a domain? You'd never know unless you checked both manually.
Central logging fixes this. One place, all logs, searchable by service and time.
The stack is three tools:
- Loki — stores logs. Lightweight, index-free, purpose-built for log lines.
- Grafana — queries and visualizes logs from Loki.
- Alloy — the agent that runs on each machine and ships logs to Loki.
Proxmox host ──┐
LXC: Jellyfin ─┤
LXC: Immich ───┤
LXC: Caddy ────┼──→ Alloy (per host) ──→ Loki ──→ Grafana
LXC: ntfy ─────┤
LXC: AdGuard ──┤
... rest ───────┘
Loki and Grafana run together on a single dedicated LXC. Alloy is a small binary installed on every host you want to collect logs from.
Why Not ELK or Graylog
Elasticsearch needs 2–4 GB RAM minimum. Graylog needs MongoDB and Elasticsearch underneath. Both are overkill for a single-node homelab.
Loki stores only log lines with labels — no full-text indexing. That makes it extremely lean. Loki and Grafana together run comfortably under 600 MB RAM. Alloy per host adds about 2–120 MB depending on how many log files it's tailing.
System Reference
| Component | Value |
|---|---|
| Loki port | 3100 |
| Grafana port | 3000 |
| Grafana default login | admin / admin |
| Alloy config path | /etc/alloy/config.alloy |
Part 1 — Loki and Grafana LXC
Use the community script to create the Loki LXC. Search for loki and run the script from your Proxmox shell. When it asks:
Would you like to install Promtail? (y/N):Answer N. Promtail is the old log shipper — Alloy replaced it.
Go through Advanced settings and set:
| Setting | Value |
|---|---|
| RAM | 1024 MB |
| Disk | 10 GB |
| CPU | 2 cores |
Put the disk on slower storage if you have it — logs are write-heavy but don't need NVMe speed.
Once the LXC is up, shell into it:
pct exec <loki-lxc-id> -- bashInstall Grafana manually — the community script only installs Loki:
apt install -y apt-transport-https wget
mkdir -p /etc/apt/keyrings
wget -q -O - https://apt.grafana.com/gpg.key | gpg --dearmor -o /etc/apt/keyrings/grafana.gpg
If it asks File '/etc/apt/keyrings/grafana.gpg' exists. Overwrite?, answer y — the Loki script already added a partial Grafana repo entry.
echo "deb [signed-by=/etc/apt/keyrings/grafana.gpg] https://apt.grafana.com stable main" > /etc/apt/sources.list.d/grafana.list
apt update
apt install -y grafana
systemctl enable --now grafana-server
You'll see logger: socket /dev/log: Connection refused warnings during install — harmless in unprivileged LXCs, Grafana installs correctly regardless.
After apt update you may see warnings like:
Warning: Target Packages (main/binary-amd64/Packages) is configured multiple times
in /etc/apt/sources.list.d/grafana.list and /etc/apt/sources.list.d/grafana.sources
This is because the Loki script already added grafana.sources. Clean it up:
rm /etc/apt/sources.list.d/grafana.listVerify both services are running:
systemctl status loki
systemctl status grafana-server
Both should show active (running).
Connect Grafana to Loki
Open Grafana in your browser at http://<loki-lxc-ip>:3000. Log in with admin / admin and set a new password when prompted.
Go to Connections → Data sources → Add new data source → Loki and set the URL to:
http://localhost:3100Click Save & Test. You should see Data source successfully connected.
Part 2 — Installing Alloy
Alloy is installed on every host you want logs from. The install process is identical across all of them.
mkdir -p /etc/apt/keyrings
wget -q -O - https://apt.grafana.com/gpg.key | gpg --dearmor -o /etc/apt/keyrings/grafana.gpg
echo "deb [signed-by=/etc/apt/keyrings/grafana.gpg] https://apt.grafana.com stable main" > /etc/apt/sources.list.d/grafana.list
apt update && apt install -y alloy
If apt update throws duplicate repo warnings (same grafana.sources situation), remove the file we just created after installing:
rm /etc/apt/sources.list.d/grafana.listSome community scripts (ntfy, for example) already ship with Alloy installed. In that case apt install -y alloy will just print alloy is already the newest version and exit cleanly — no action needed.
Finding the right log paths
Before writing the Alloy config for each host, always check where the service actually logs:
# Check for a log directory
ls /var/log/<service>/ 2>/dev/null || echo "no log directory"

# Check if it uses systemd journal
journalctl -u <service-name> --no-pager -n 5

# If you're not sure of the unit name
systemctl list-units --type=service --state=running
Most self-hosted services on Debian/Ubuntu fall into one of two categories — they either write to a log file under /var/log/<service>/ or /var/lib/<service>/logs/, or they log purely to the systemd journal. The Alloy config differs slightly between the two.
Part 3 — Alloy Config Patterns
Every Alloy config starts with the same Loki destination block:
loki.write "default" {
  endpoint {
    url = "http://<loki-ip>:3100/loki/api/v1/push"
  }
}
Everything else is sources that feed into this destination.
Pattern A — Journal only
For services that log to systemd journal with no log files (Caddy, ntfy, AdGuard Home, Uptime Kuma, Beszel, apprise-api, Byparr):
loki.write "default" {
  endpoint {
    url = "http://<loki-ip>:3100/loki/api/v1/push"
  }
}

loki.source.journal "journal" {
  forward_to = [loki.write.default.receiver]
  labels = {
    hostname = "<hostname>",
    service  = "<service-name>",
  }
}
Pattern B — Journal plus log files
For services that write structured logs to files (Jellyfin, Sonarr, Radarr, Immich):
loki.write "default" {
  endpoint {
    url = "http://<loki-ip>:3100/loki/api/v1/push"
  }
}

loki.source.journal "journal" {
  forward_to = [loki.write.default.receiver]
  labels = {
    hostname = "<hostname>",
  }
}

local.file_match "<service>" {
  path_targets = [{
    __path__ = "/path/to/service.log",
    hostname = "<hostname>",
    service  = "<service-name>",
  }]
}
loki.source.file "<service>" {
  targets    = local.file_match.<service>.targets
  forward_to = [loki.write.default.receiver]
}
Repeat the local.file_match + loki.source.file block pair for each additional log file.
Part 4 — Service-Specific Configs
Caddy
Caddy logs to the systemd journal by default unless you explicitly add a log block to your Caddyfile. Journal-only config:
loki.write "default" {
  endpoint { url = "http://<loki-ip>:3100/loki/api/v1/push" }
}

loki.source.journal "journal" {
  forward_to = [loki.write.default.receiver]
  labels = { hostname = "caddy", service = "caddy" }
}
If you want structured JSON access logs, add this to your Caddyfile and restart Caddy:
log {
  output file /var/log/caddy/access.log
  format json
}
Then add a file source for /var/log/caddy/access.log alongside the journal source.
Jellyfin
Jellyfin writes daily log files to /var/log/jellyfin/. It also creates FFmpeg remux logs for each transcode session — those are noise and should be excluded with a specific glob:
// Use jellyfin*.log to match daily logs only, not FFmpeg remux logs
local.file_match "jellyfin" {
  path_targets = [{
    __path__ = "/var/log/jellyfin/jellyfin*.log",
    hostname = "jellyfin",
    service  = "jellyfin",
  }]
}
Sonarr and Radarr
Both write to /var/lib/<app>/logs/. They generate a large number of rotated debug logs (sonarr.debug.0.txt, sonarr.debug.1.txt, ...) alongside the active log. Ship only the active log:
local.file_match "sonarr" {
  path_targets = [{
    __path__ = "/var/lib/sonarr/logs/sonarr.txt",
    hostname = "jellyfin",
    service  = "sonarr",
  }]
}

local.file_match "radarr" {
  path_targets = [{
    __path__ = "/var/lib/radarr/logs/radarr.txt",
    hostname = "jellyfin",
    service  = "radarr",
  }]
}
Why not *.txt? The rotated debug logs can be 50+ files deep. Tailing all of them adds noise and wastes Loki ingest capacity on logs you'll never query.
Immich
Immich splits logs across two files — web.log for the main application and ml.log for the machine learning service (face recognition, CLIP embeddings):
local.file_match "immich_web" {
  path_targets = [{
    __path__ = "/var/log/immich/web.log",
    hostname = "immich",
    service  = "immich-web",
  }]
}

local.file_match "immich_ml" {
  path_targets = [{
    __path__ = "/var/log/immich/ml.log",
    hostname = "immich",
    service  = "immich-ml",
  }]
}
Beszel, ntfy, AdGuard Home, Uptime Kuma, apprise-api, Byparr
All journal-only. Use Pattern A with the appropriate hostname and service label. The unit names for reference:
| Service | Systemd unit |
|---|---|
| Beszel hub | beszel-hub.service |
| ntfy | ntfy.service |
| AdGuard Home | AdGuardHome.service |
| Uptime Kuma | uptime-kuma.service |
| apprise-api | apprise-api.service |
| Byparr | byparr.service |
Part 5 — Proxmox Host
Alloy runs directly on the Proxmox host, not inside an LXC. Install it the same way:
mkdir -p /etc/apt/keyrings
wget -q -O - https://apt.grafana.com/gpg.key | gpg --dearmor -o /etc/apt/keyrings/grafana.gpg
echo "deb [signed-by=/etc/apt/keyrings/grafana.gpg] https://apt.grafana.com stable main" > /etc/apt/sources.list.d/grafana.list
apt update && apt install -y alloy
The Proxmox host config ships the systemd journal plus any cron-driven backup scripts that write to /var/log/:
loki.write "default" {
  endpoint {
    url = "http://<loki-ip>:3100/loki/api/v1/push"
  }
}

loki.source.journal "journal" {
  forward_to = [loki.write.default.receiver]
  labels = {
    hostname = "proxmox",
    service  = "proxmox-host",
  }
}

local.file_match "lxc_backup" {
  path_targets = [{
    __path__ = "/var/log/lxc-backup.log",
    hostname = "proxmox",
    service  = "lxc-backup",
  }]
}
loki.source.file "lxc_backup" {
  targets    = local.file_match.lxc_backup.targets
  forward_to = [loki.write.default.receiver]
}

local.file_match "gdrive_sync" {
  path_targets = [{
    __path__ = "/var/log/gdrive-sync.log",
    hostname = "proxmox",
    service  = "gdrive-sync",
  }]
}
loki.source.file "gdrive_sync" {
  targets    = local.file_match.gdrive_sync.targets
  forward_to = [loki.write.default.receiver]
}

local.file_match "git_config_backup" {
  path_targets = [{
    __path__ = "/var/log/git-config-backup.log",
    hostname = "proxmox",
    service  = "git-config-backup",
  }]
}
loki.source.file "git_config_backup" {
  targets    = local.file_match.git_config_backup.targets
  forward_to = [loki.write.default.receiver]
}
Enable and start:
systemctl enable --now alloy
systemctl status alloy --no-pager
Note on backup script logs: Alloy only ships new lines from the point it starts tailing. Existing log history won't be backfilled. The next time your cron jobs run, their output will appear in Loki automatically.
Part 6 — Querying Logs in Grafana
Go to Explore in Grafana and select the Loki data source.
Some useful starting queries:
# All logs from a specific service
{service="sonarr"}

# All logs from a specific host
{hostname="jellyfin"}

# Errors across everything
{hostname=~".+"} |= "error"

# Backup script results
{service="lxc-backup"}

# AdGuard blocks (if journal logging is verbose)
{hostname="adguard"} |= "blocked"

# All logs across all hosts
{hostname=~".+"}
The Label browser button in Explore shows all available label values — useful for discovering what's flowing in without remembering exact names.
Loki Retention
Loki's default retention is unlimited — it will fill your disk eventually. Set a retention period in /etc/loki/config.yml:
limits_config:
  retention_period: 336h  # 14 days
Restart Loki after changing:
systemctl restart loki14 days is a reasonable default for a homelab. Adjust based on your disk size and how far back you realistically need to look.
Also enable the compactor — without it, Loki stores logs forever regardless of the retention setting:
compactor:
  working_directory: /var/lib/loki/compactor
  retention_enabled: true
  delete_request_store: filesystem
Part 7 — Debian 13 Journal Gotchas
This section only applies to LXCs running Debian 13 (trixie) — the default OS for most community scripts as of 2026. Ubuntu-based LXCs (like the Jellyfin stack) are unaffected.
The problem
Debian 13 LXCs don't persist the systemd journal to disk by default. Without a persistent journal at /var/log/journal/, Alloy's loki.source.journal source starts up without errors but ships absolutely nothing. The only symptom is an empty positions: {} in Alloy's data directory.
Additionally, systemd-journald fails to start in unprivileged LXCs unless you disable a credentials feature it tries to use:
systemd-journald.service failed — status=243/CREDENTIALSThe fix
Run this once from the Proxmox host for all affected Debian LXCs:
for id in 151 152 154 157 158 159 160 161 162; do
  echo "=== LXC $id ==="
  pct exec $id -- bash -c "
    mkdir -p /var/log/journal
    chown root:systemd-journal /var/log/journal
    chmod 2755 /var/log/journal
    systemd-tmpfiles --create --prefix /var/log/journal
    mkdir -p /etc/systemd/system/systemd-journald.service.d/
    cat > /etc/systemd/system/systemd-journald.service.d/override.conf << 'EOF'
[Service]
LoadCredential=
ImportCredential=
EOF
    systemctl daemon-reload
    systemctl restart systemd-journald
    journalctl --flush
    chown -R root:systemd-journal /var/log/journal
    chmod -R 2755 /var/log/journal
    usermod -aG systemd-journal alloy
    chown -R alloy:alloy /var/lib/alloy/
    systemctl restart alloy
  "
done
What this does step by step:
- Creates
/var/log/journal/so journald has somewhere to write persistent logs - Disables the credentials feature via a drop-in override so journald can start in an unprivileged LXC
- Sets correct group ownership so the
alloyuser can read journal files via thesystemd-journalgroup - Fixes
/var/lib/alloy/data/ownership in case Alloy previously ran as root
The machine ID path issue
After the fix above, most LXCs will work with no path in the Alloy journal config. However on some LXCs (observed behaviour — not fully explained) Alloy silently reads nothing even with the journal present and permissions correct. The positions.yml stays at positions: {}.
The reliable fix is to point Alloy directly at the machine ID subdirectory:
loki.source.journal "journal" {
  path    = "/var/log/journal/<machine-id>"
  max_age = "1h"
  forward_to = [loki.write.default.receiver]
  labels = { hostname = "<hostname>" }
}
Get the machine ID with:
cat /etc/machine-idThe machine ID is permanent — it's generated at LXC creation and never changes unless you destroy and rebuild the LXC. Hardcoding it is safe.
Verifying everything is shipping
Check the position file on each LXC — a valid cursor means Alloy is actively reading and shipping:
for id in 151 152 154 157 158 159 160 161; do
  echo "=== LXC $id ==="
  pct exec $id -- cat /var/lib/alloy/data/loki.source.journal.journal/positions.yml 2>/dev/null | grep -c "cursor" && echo "shipping" || echo "NOT shipping"
done
Backup log panels showing no data
Alloy only ships new lines from the point it starts tailing — it doesn't backfill existing log history. Backup script logs will only appear in Grafana after the cron jobs next run. Set the Grafana time range to Last 24h or Last 2d to see logs from previous runs. Panels showing "No data" at 1am are expected — the backup cron runs at 2am.
What You End Up With
| Host | Services logged | Method |
|---|---|---|
| Proxmox | Host journal, LXC backup, GDrive sync, Git config backup | Journal + files |
| Immich | immich-web, immich-ml | Journal + files |
| Caddy | caddy, tailscale | Journal |
| Jellyfin LXC | Jellyfin, Sonarr, Radarr, Prowlarr, qBittorrent, Overseerr | Journal + files |
| Uptime Kuma | uptime-kuma | Journal |
| Beszel | beszel-hub | Journal |
| ntfy | ntfy | Journal |
| apprise-api | apprise-api, nginx | Journal |
| AdGuard Home | AdGuardHome | Journal |
| Byparr | byparr | Journal |
Every service's logs are now searchable from one Grafana interface. When something breaks at 2am and you need to correlate a Sonarr grab failure with an AdGuard block and a Caddy 502, it's one query instead of ten SSH sessions.
What's Next
With logs centralized, the next step is setting up Loki alerting rules to push notifications to ntfy when error rates spike — closing the loop between the logging stack and the notification stack already in place.
Beszel: Lightweight Monitoring for Your Proxmox Homelab
A complete walkthrough for setting up Beszel on Proxmox — spin up a dedicated LXC hub, deploy agents across all containers via pct exec, monitor the Proxmox host itself with Intel GPU support, and optionally expose the dashboard via Caddy reverse proxy.
From a Dead Laptop to a Running Homelab
How a broken HP Pavilion sparked a journey into enterprise-grade home infrastructure.